Farmers across the United States will be able to monitor their crops in real time, thanks to a novel algorithm from researchers in South Dakota State University's Geospatial Sciences Center of Excellence.
Two years ago, Yu Shen, research assistant in the GSCE, and Xiaoyang Zhang, professor in the Department of Geography and Geospatial Sciences and co-director at the GSCE, began investigating if it would be possible to make crop monitoring more efficient.

"Previously, crop progress was monitored by visually looking at the plants," Shen explained.
Monitoring crops currently requires around 5,000 reporters from across the U.S. who fill out weekly surveys based on the visual observations of fields in their area of the country. Based on standard definitions, reporters estimate the progress of crops through their stages of development while also providing subjective evaluations of crop conditions. Those surveys are then submitted to the National Agricultural Statistics Service, which creates weekly crop progress reports that are categorized by state.
Farmers rely on these reports, which are currently the best field-based crop progress information available at the regional to state level and are distributed by the U.S. Department of Agriculture.
This process, while fairly accurate, is time consuming, costly and subjective.

Shen and Zhang believed timely satellite remote sensing data could be used to create a more efficient monitoring system. Satellite observations have long been used to analyze historical crop phenology—the development stages of crop growth, from planting to harvest. However, utilizing them to develop a near-real-time crop monitoring system had not been widely investigated.
"We thought we could improve on crop monitoring by making it more time and cost efficient," Shen said. "We proposed utilizing timely satellite observations to develop an operational algorithm."
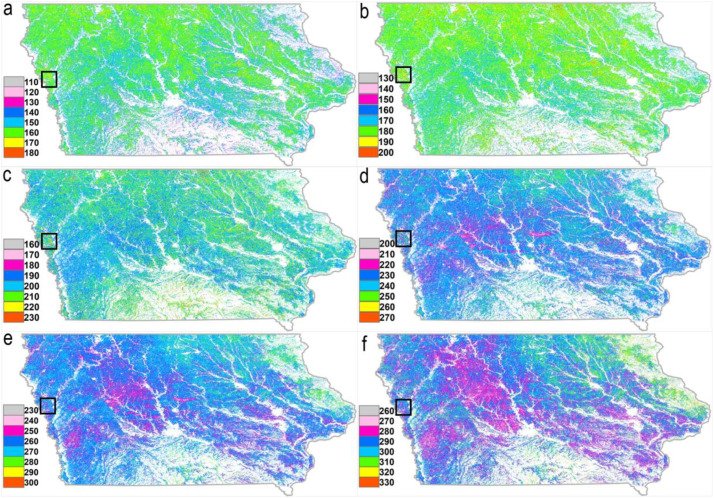
By fusing 30-meter spatial observations from the polar-orbiting satellites of Landsat, Sentinel-2 and temporal observations from the geostationary satellite, the research team was able to calculate high spatial and high temporal crop greenness development for operational near-real-time crop monitoring.
"Our results provide accurate timing for crop phenology," Shen said. "This information can help guide farmers in their crop management."
Unlike previous work, this novel algorithm can monitor crop growth at a 30-meter field scale. It can calculate six dates of crop growth transition stages—the start of growing season (onset of greenness increase), the middle of spring (date of mid-greenup phase), maturity onset (onset of greenness approaching maximum), the start of fall (onset of greenness beginning to decrease), the middle of fall (date of mid-senescence phase), and the end of the growing season (onset of greenness reaching minimum)—before the phenological event occurs with increasing accuracy around and after the event. These transition dates are applied to determine crop growth stages, such as the timings of planting, emergence, silking, dough, dented, maturity and harvest for corn.
The research team spent significant time validating the results of the algorithm by comparing the predictions with actual ground-level measurements from the 2020 corn and soybean growing season in Iowa. They found the real-time prediction capabilities were in line with the progress reports (distributed by the USDA) from that same year.

"With the predictions at each field, the near-real-time monitoring of crop phenology offers robust spatially distributed crop progress information from local fields to the entire state," Shen said. "This is a great improvement compared with state-based National Agricultural Statistics Service crop progress reporting."
The results from this algorithm will provide accurate measurements of crop phenology, Shen said, which will guide farmers in their crop management.
"For example, our algorithm will provide the timing of the crop greenness reaching its maximum," Shen said. "This stage is the window in which farmers should do their irrigation. We will be able to predict when this stage will occur prior to it happening. They will be able to schedule their irrigation ahead of time."
Shen predicts the information will also help estimate yield size prior to harvest.
Zhang indicates that the algorithm with operational computer codes is to become a new geospatial tool for monitoring crop progress and condition in near real time. This tool will eventually be delivered to the USDA for integrating into existing operational systems for widespread use. Users will be able to see individual fields' crop conditions through an interactive map.
Future avenues of research will see the team investigating ways to improve the algorithm's accuracy for short-term predictions. Applications of this geospatial tool at national and global scales could help evaluate worldwide food security.
Funding for this project came by way of grants from the U.S. Department of Agriculture and the National Aeronautics and Space Administration. This study was published in the academic journal Remote Sensing of Environment.
- Contact:
- Telephone number: 605-688-6161
Republishing
You may republish SDSU News Center articles for free, online or in print. Questions? Contact us at sdsu.news@sdstate.edu or 605-688-6161.

