The 2022 South Dakota Election Study was conducted between Sept.28 to Oct. 10,2022 by The South Dakota Polling Project, a non-partisan research group housed in the School of American and Global Studies at South Dakota State University. This poll is similar to election surveys conducted in May 2022 and October 2020. In this survey, 565 registered South Dakota voters answered questions about the upcoming November election. The margin of error of this survey was +/- 4 percent, on par with other state-wide polls.
The Gubernatorial Race
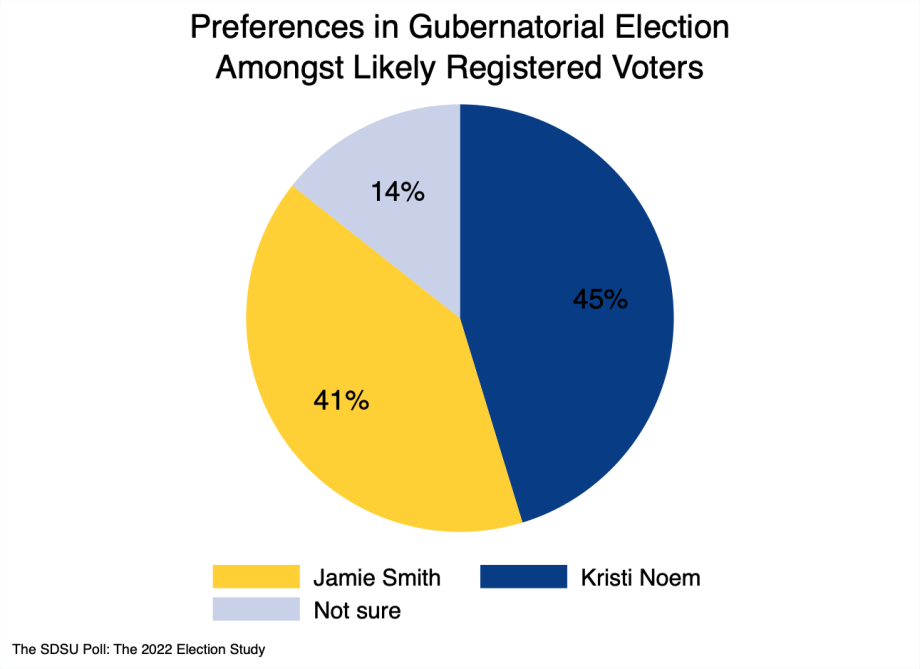
Overall results: Our data show Gov. Kristi Noem with a lead of 4% over rival South Dakota State Sen. Jamie Smith, which is roughly the same difference as in the 2018 election. Considering the margin of error for this poll is 4%, this race is indeed quite close.
A rather large portion of the electorate, 14%, indicated that they had not yet decided. Given the structure of partisanship in South Dakota, we expect that a majority of these undecided respondents will break toward the governor come election time when “not sure” isn’t a choice.
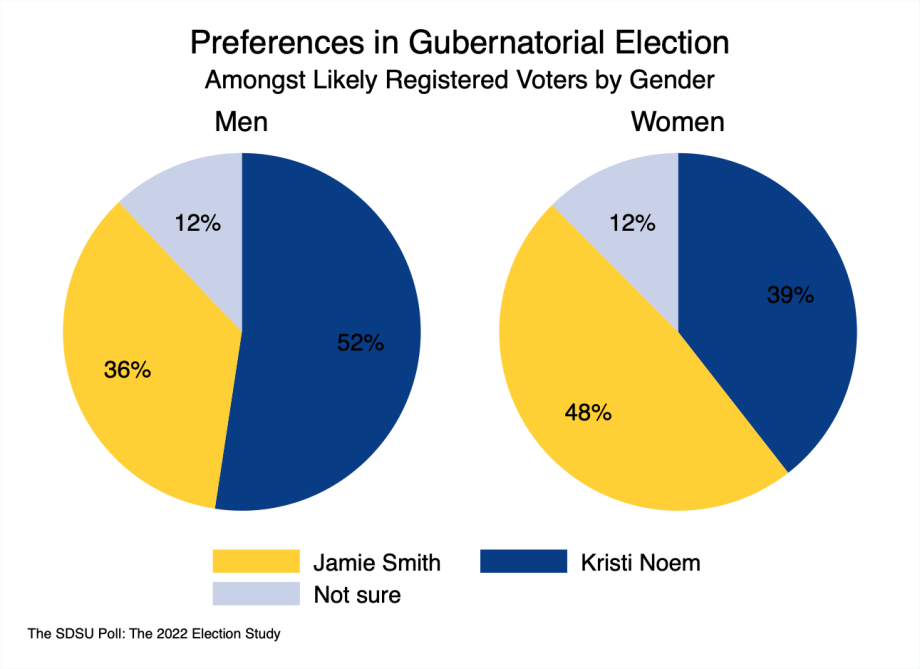
The gender gap: A distinct gender gap is apparent within the electorate this cycle, a bit sharper than surveyed at the same time in 2018. Nationally, Democrats have an advantage among women, which holds true for the South Dakota electorate as well. One month out from the election, the gender gap between men and women in support of the governor is 13%.
As we will see, a virtually identical gender gap exists in the Thune-Bengs Senate race. This suggests that the gap is due to the Republican Party’s weakness amongst women, rather than a trait of any particular candidate.
It is widely speculated in the popular media that the overturning of Roe v. Wade in the Dobbs v. Jackson decision earlier this year has punctuated the gender gap across the board. Only careful analysis after the election will bring clarity to this theory. Note, the numbers don’t always add up to 100 due to rounding.
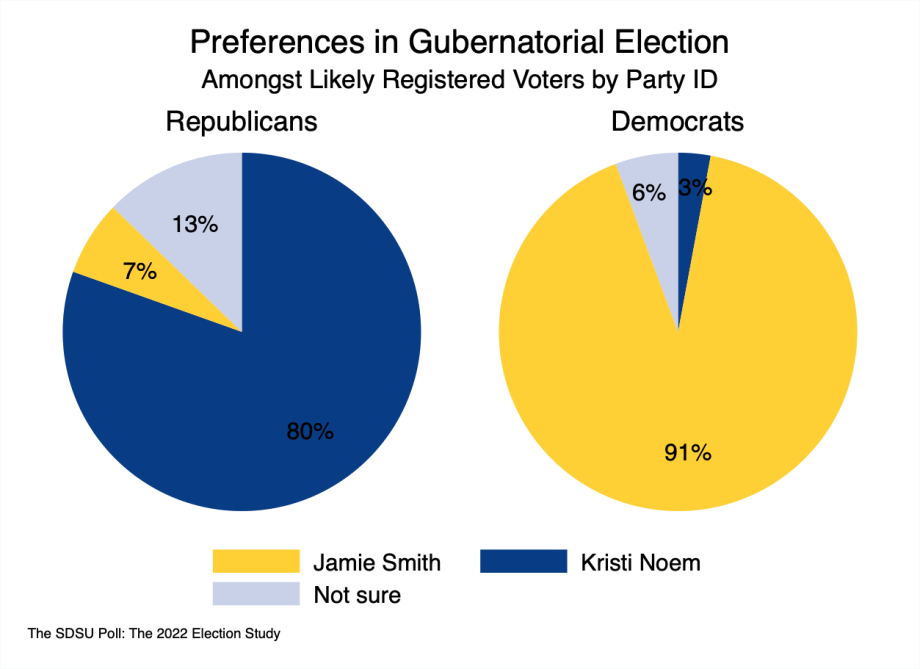
Partisan distinctions:Our results also show that the parties differ slightly on the degree of unity for their respective candidates. While the overwhelming majority of identifiers of both parties are falling in line with their nominees, there is a higher degree of dissent among Republicans.
About 7% of self-identified Republicans said they were voting for Senator Smith, whereas only 3% of self-identified Democrats indicated they would defect toward Gov. Noem. Roughly twice the number of Republicans said they were undecided than Democrats, at 13% and 6% respectively.
The behavior of the undecided voters is key, and again we believe that most will break towards their own party, thus giving the governor an edge amongst undecided voters. This is largely due to a phenomenon called “negative partisanship” where one’s animosity towards the other party is greater than the positive feelings they have of their own.
A few decades ago, if a voter had any reservations about their own party’s nominee, it wasn’t as long of a stretch to simply split their ticket and vote for the other nominee, since voters didn’t dislike their opposing partisans to the degree they do today. Negative partisanship is at play in both Republican and Democratic parties and explains the dramatic drop in ticket-splitting in the last two decades.
We expect that most of that 13% of undecided Republicans will not be willing to vote for any Democrat when they are forced to choose between the nominees. Any misgivings they might have about their nominee will wash away due to their antipathy towards their political other.
Overall, we expect that the race will be relatively close by South Dakota standards, just as Noem’s 2018 victory was. Given the poll’s 4% margin of error, a Smith victory is not out of the question, but it is an uphill battle given the political landscape of the state.
The Senatorial Race
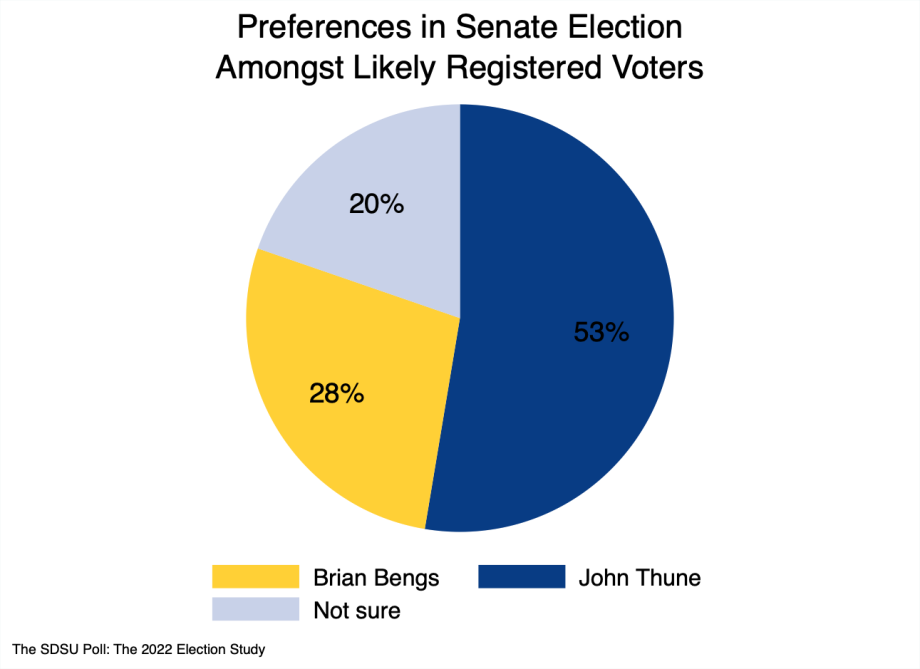
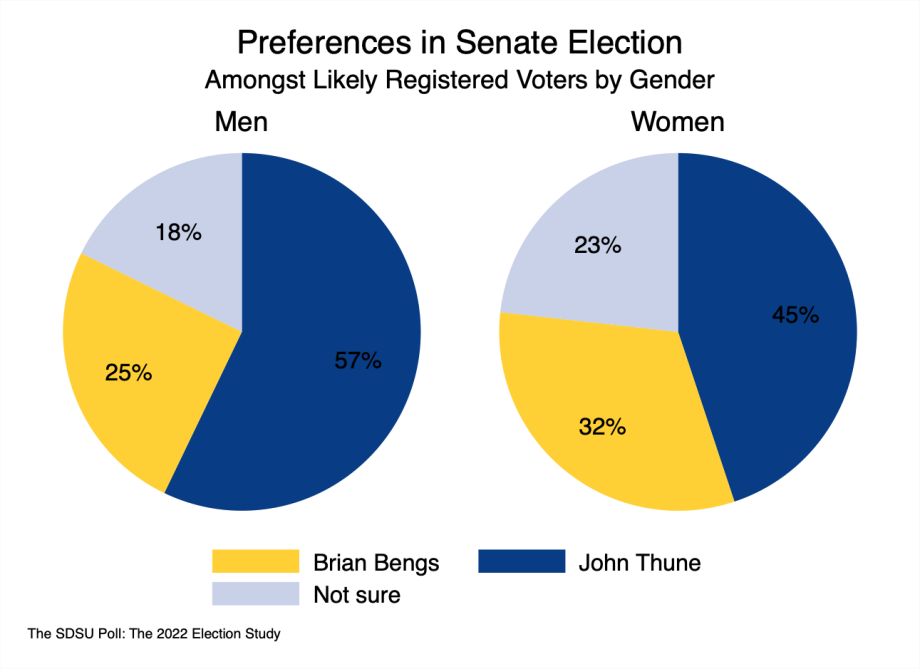
Overall results: Our results in the election for the United States Senate seat reflect the odd combination of the fractious nature of the June primary and a safe Republican constituency. Though the result of the primary was never really in doubt, it was clear that the “Trump” wing of South Dakota Republicans had some reservations about the senator. However, once he cleared the primary, Thune’s reelection was assumed to be a lock.
Though Sen. Thune’s showing in the poll is well below his nearly 72% showing in 2016, we expect that a majority of the 20% undecided voters will break for Sen. Thune for the same reasons we discussed in the gubernatorial race. When undecided Republicans are ultimately forced to choose, negative partisanship makes it highly unlikely that they would vote for Democrat Brian Bengs. Note, the numbers don’t add up to 100 due to rounding.
The gender gap: Just as we saw in the gubernatorial race, a distinct and equally sized gap is apparent in the degree of support for Thune between men and women; a difference of 12%. What is critical to note, however, is that Thune is still leading amongst women by a pretty large margin. There are also more undecided women than men. Again, we expect that most of these undecided voters will ultimately cast votes for their party’s nominee, giving Thune a safe reelection.
Our press releases will continue all week. Wednesday, we will look at South Dakotans’ opinions on abortion. Thursday, we present the results of the measures to legalize recreational marijuana and expand Medicaid. On Friday, we will look at long-term partisan trends in the state and the popularity of several politicians at the state and national levels.
Contributors: David Wiltse Ph.D. and Filip Viskupič Ph.D.
- Contact:
- Telephone number: 605-688-6367
Republishing
You may republish SDSU News Center articles for free, online or in print. Questions? Contact us at sdsu.news@sdstate.edu or 605-688-6161.