Radiometric Calibration refers to the ability to convert the digital numbers recorded by satellite imaging systems into physical units. Those units are either radiance (W/m2/sr/µm) or apparent top-of-atmosphere reflectance.
Vicarious-based Absolute
This type of calibration is performed using a team of experts deployed at our calibration site in Brookings, SD. At the time of satellite overpass, while the system is imaging our site, the team collects hyperspectral surface reflectance measurements. Concurrently, a sun photometer measures the transmittance of the atmosphere. These measurements, along with local meteorological data, are used as inputs to a radiative transfer code, Modtran and the output of this software provides an estimate of the amount of energy reaching the top of the atmosphere where the satellite is. This estimate is ratioed with the satellite measured energy value and a calibration correction coefficient is generated, or the estimate is ratioed with the digital number produced by the satellite and a calibration coefficient is generated. These coefficients are calculated for each spectral band of the sensor and are provided to the customer as the desired output of our work. An example of the output data produced from this work is shown in Figure 1.
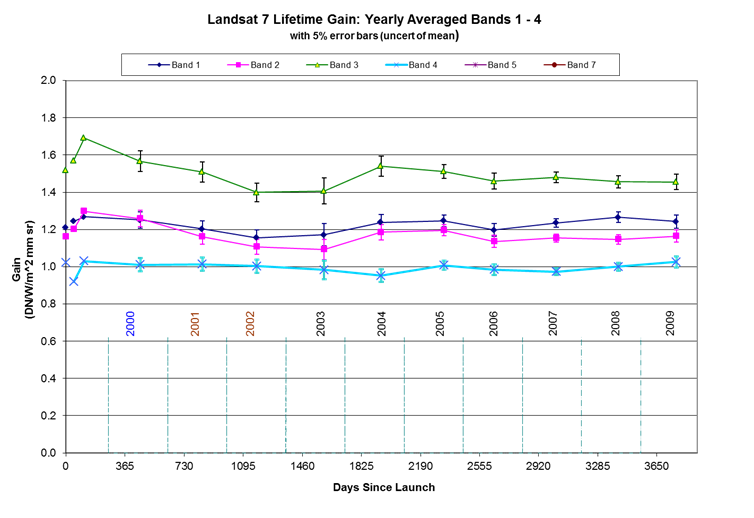
Figure 1 shows an example of data produced by Vicarious-based Absolute Calibration. This plot shows a summary for each year the IP Lab calibrated the U.S. Landsat 7 satellite. The data points give the values for the radiometric gain for this satellite in four spectral bands, along with the uncertainty associated with each measurement. These gain values allow users of the satellite data to convert the digital numbers obtained from the sensor into physical units of energy.
PICS-based Absolute
This work is similar to the previous activity but uses a different source for the calibration of the satellite instrument. Pseudo Invariant Calibration Sites (PICS) are locations on the Earth's surface where the surface reflectance properties are constant; they do not change over time. Hence, they can be used as calibration sources. The optimal regions are also located where there is minimal atmospheric variation. Therefore, the amount of energy reaching the top-of-atmosphere remains relatively constant and can be predicted. The best locations for PICS are in deserts, with the best desert locations being in the Sahara Desert. However, we do use calibration sites in other locations including the U.S.
By observing these sites with satellite sensor systems over extended periods of time, degradations (trends) in sensor responsivity can be monitored and quantified. One product, then, is degradation of satellite responsivity over time. A second estimate can also be made through cross-calibration with an accurately calibrated satellite sensor that can be used as a reference radiometer. Currently, we use the MODIS satellite sensors as our calibrated radiometer. This sensor monitors the upwelling radiance of the PICS locations. By comparing customer’s sensor’s measurement to this reference value, calibration correction coefficients can be generated for the customer. An example of the output data produced from this work is shown in Figure 2.
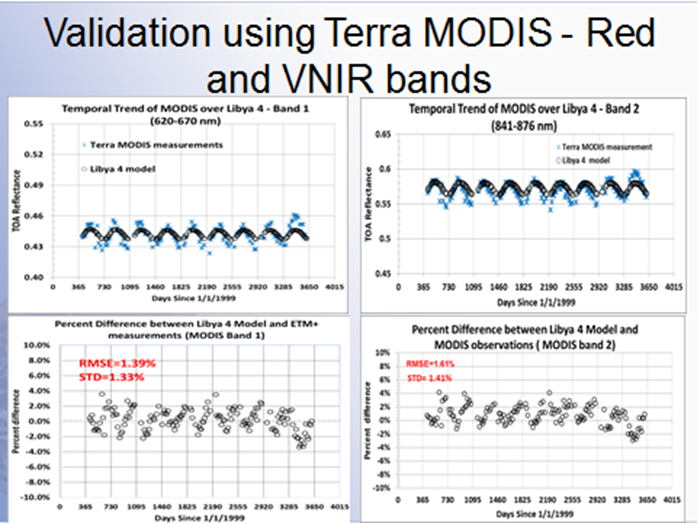
Figure 2 shows output data from PICS-based Absolute Radiometric Calibration. In this set of plots, estimates of top-of-atmosphere reflectance predicted from the PICS absolute radiometric calibration model are compared to actual top-of-atmosphere reflectance values measured by the U.S. Terra MODIS satellite. The model predictions are the black circles in the top two plots for the red and NIR bands. The blue asterisks indicate actual Terra MODIS measurements. The bottom two plots show the associated differences between model predicted and actual measured values. This is the same type of information that is provided to customers of the SDSU IP Lab who request PICS-based calibration of their sensor.
Relative Radiometric Calibration
While the previous two categories provided an absolute calibration (conversion of satellite digital numbers to physical units), this category provides a relative calibration from one detector onboard the satellite sensor to another detector on the system. All the systems that we work with contain multiple detectors, and each detector has a slightly different responsivity. Therefore, the imagery produced by these sensors may contain a significant level of striping due to this problem. Our work estimates these differences in responsivity and determines a correction factor. Two methods are employed to obtain these estimates.
The first method, used with sensors with push broom detector arrays, employs a satellite maneuver known as side-slither or 90 degree yaw. In this case the satellite is oriented so that the detector array is aligned with the ground path and each detector views the same points on the ground. Using this information, the relative detector response can readily be calculated and relative gain coefficients can be supplied to the customer.
The second method uses statistics obtained from the imagery collected by the satellite. Over a large number of images, overall detector means are calculated for each detector. With a large enough sample size, each detector will see the same information in a statistical sense. The ratio of the means of the data observed by each detector then becomes the relative gain correction coefficients. These are supplied to the customer and used to remove striping from the imagery. An example of the output data produced from this work is shown in Figure 3.
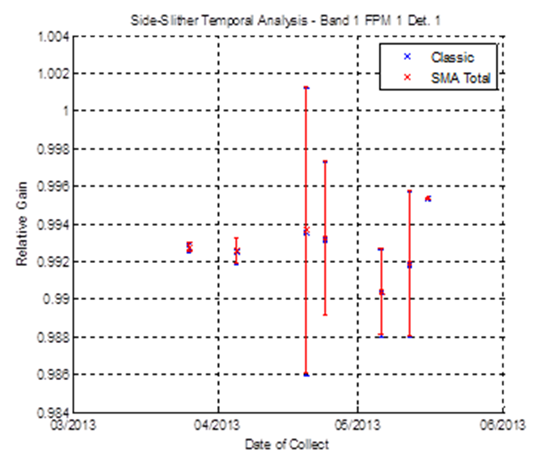
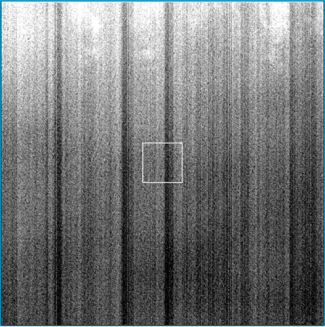
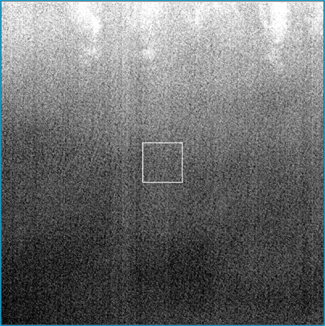
Figure 3 shows an example of Relative Radiometric Calibration Estimates. This plot shows estimates of the relative gains based on side slither maneuvers for the Landsat 8 Operational Land Imager for a detector in Band 1 on the first module of the focal plane. Each data point is an estimate of the radiometric gain of that detector relative to the average radiometric gain on that module, hence the values are close to one. These estimates are calculated for each detector on the instrument (~70,000 detectors for the Operational Land Imager). This value is divided into each pixel value recorded by the detector to remove the effects of differing relative radiometric gains for the detectors. An example, using a uniform image from Greenland, is shown below before and after this correction is applied. Notice the substantial reduction of the striping artifacts produced by the sensor.